
Characteristics of the GlobalUsefulNativeTrees database
The GlobalUsefulNativeTrees (GlobUNT) can be accessed via https://worldagroforestry.org/output/globalusefulnativetrees. GlobUNT is managed and has been designed to be updated regularly (see discussion) among a wider set of tools available from the CIFOR-ICRAF Global Tree Knowledge Platform (https://www.worldagroforestry.org/tree-knowledge). This wider set of tools includes the Agroforestry Species Switchboard23, an online database that was designed to assist users in finding information for a particular plant species across 50+ information sources and to which each species in GlobUNT has been hyperlinked. GlobUNT is managed also as part of a stepwise methodology named “Climate Appropriate Portfolios of Tree Diversity” that is deployed and field-tested by CIFOR-ICRAF24. GlobUNT is hyperlinked with the GlobalTree Portal22, thereby enabling users to check on the conservation status and actions for filtered species.
At the global level, the richness of useful native tree species (Su) was 14,014, representing roughly one third (33.7%) of all plant species with documented uses in the World Checklist of Useful Plant Species (WCUPS) and one quarter (24.2%) of all tree species documented by GlobalTreeSearch (Table 1). Only one use category had a global Su lower than 1000 (Invertebrate Food with 712); this was also the category in the WCUPS with lowest richness overall. Among the 14,014 species in the database, 64 species (0.5%) were listed for all ten use categories. These species were from 56 genera and with five genera that included more than one species (Cordia, Prosopis, Tarchonanthus, Vachellia and Ziziphus). GlobUNT lists 118 species (0.8%) for nine use categories and 209 (1.5%) for eight. The database contains 6776 species (48.3%) that had only one use category and 2871 species (20.5%) that had two.
Table 1 Species richness in GlobalUsefulNativeTrees (GlobUNT) for the ten countries with highest richness overall.
At a plant family level, the total number in GlobUNT was 234 (GlobalTreeSearch includes 261 families). The total number of plant genera was 2599. The twenty genera with the highest Su were Ficus (287), Syzygium (189), Diospyros (184), Eucalyptus (155), Quercus (117), Terminalia (99), Acacia (98), Elaeocarpus (96), Garcinia (96), Croton (94), Prunus (93), Coffea (90), Pinus (87), Salix (82), Macaranga (75), Dombeya (74), Shorea (74), Commiphora (73), Magnolia (69) and Ilex (67).
The global native distribution of useful tree species by major use categories
At a continental level, tropical Asia had the highest Su overall with 5177 species (Supplementary Table 1), followed by Africa (3413), Southern America (3158) and temperate Asia (2118). Two continents had Su below 1000, the Pacific (530) and Europe (299).
At a sub-continental level, Su varied from 3349 to 4 (Supplementary Table 1). The value was highest overall in Malesia (comprised of Brunei Darussalam, Christmas Island, Cocos Islands, Indonesia, Malaysia, Philippines, Singapore and Timor-Leste) and lowest in Subarctic America (Greenland). Su was also largest in Malesia for Materials (MA, 2723), Medicines (ME, 1533), Human Food (HF, 958), Fuel (FU, 734), Environmental Uses (EU, 632), Social Uses (SU, 614), Animal Food (AF, 443), Poisons (PO, 322) and Invertebrate Food (IF, 266) (Fig. 1). Indo-China (Cambodia, Lao People’s Democratic Republic, Thailand and Viet Nam) ranked second highest for MA (1488). West-Central Tropical Africa (Burundi, Cameroon, Central African Republic, Congo, The Democratic Republic of the Congo [DRC], Equatorial Guinea, Gabon, Rwanda and Sao Tomé and Principe) ranked highest for Su in Gene Sources (GS, 476; this category of reported uses includes wild relatives of major crops which may be valuable for breeding programs) and second highest for HF (819) and PO (314). South Tropical Africa (Angola, Malawi, Mozambique, Zambia and Zimbabwe) ranked second highest in Su for EU (631), GS (438) and AF (405). Papuasia (Papua New Guinea and the Solomon Islands) had the second highest Su for FU (640), SU (547) and IF (245). The Indian Subcontinent (Bangladesh, Bhutan, India, Maldives, Nepal, Pakistan and Sri Lanka) ranked second for ME (1470). Western South America (the Plurinational State of Bolivia, Colombia, Ecuador and Peru) that ranked third overall in Su (1883) never ranked second or third for separate use categories.
Figure 1
Subcontinental species richness for GlobalUsefulNativeTrees across different use categories. AF, Animal Food. EU, Environmental Uses. FU, Fuel. GS, Gene Sources. HF, Human Food. IF, Invertebrate Food. MA, Materials. ME, Medicines. PO, Poisons. SU, Social Uses (See 20 for definitions of reported uses). Supplementary Table 1 includes data for 242 countries and territories, 42 subcontinents and 8 continents for the 10 use categories. Supplementary Figure 1 provides country boundaries. Map created in R with Equal Earth projection.
At a country/territory level, the species richness of native trees documented to be useful in GlobUNT (Su) ranged between 2724 and 1 (Supplementary Table 1). The Malesian countries of Indonesia and Malaysia ranked first and second in overall Su with 2724 and 2115 species respectively. Indonesia also ranked first for MA (2291), HF (833), FU (701), SU (571), EU (553), AF (425), PO (280) and IF (257). Brazil, the most species-rich country in the GlobalTreeSearch database with 8791 species (Supplementary Table 1) ranked third overall in Su (1772) and only had the same ranking for ME (1143) and otherwise ranked significantly lower for individual use categories with a highest sixth ranking for MA (1059). Colombia that ranked second in GlobalTreeSearch (5943 species) only ranked eighth for GlobUNT (1342). India ranked first overall in Su for ME (1290). The DRC ranked first overall in Su for GS (367) and second highest for HF (632). China ranked second overall in Su for EU (551, only two species lower than the best-ranked Indonesia) and GS (215).
The global native distribution of endemism and threat status of useful tree species
To further explore the potential of GlobUNT for contributing to biodiversity conservation along with livelihood provision, we analysed the distributions of endemic and threatened useful trees.
When classifying endemism as being native to a single country or territory only, the richness of endemic species (Se1) was largest in the subcontinents of Australia (557, Fig. 2, Supplementary Table 2) and the Western Indian Ocean (British Indian Ocean Territory, Comoros, Madagascar, Mauritius, Mayotte, Réunion and Seychelles, 515), followed by Malesia (513), Brazil (383) and the Indian Subcontinent (316). The two countries with highest Se1 were Australia (557) and Madagascar (432), followed by Brazil (383) and Papua New Guinea (287). There were 64 countries where Su included none of the single-country endemics (the country with the highest number of endemics in GlobalTreeSearch among these was Haiti with 163 species).
Figure 2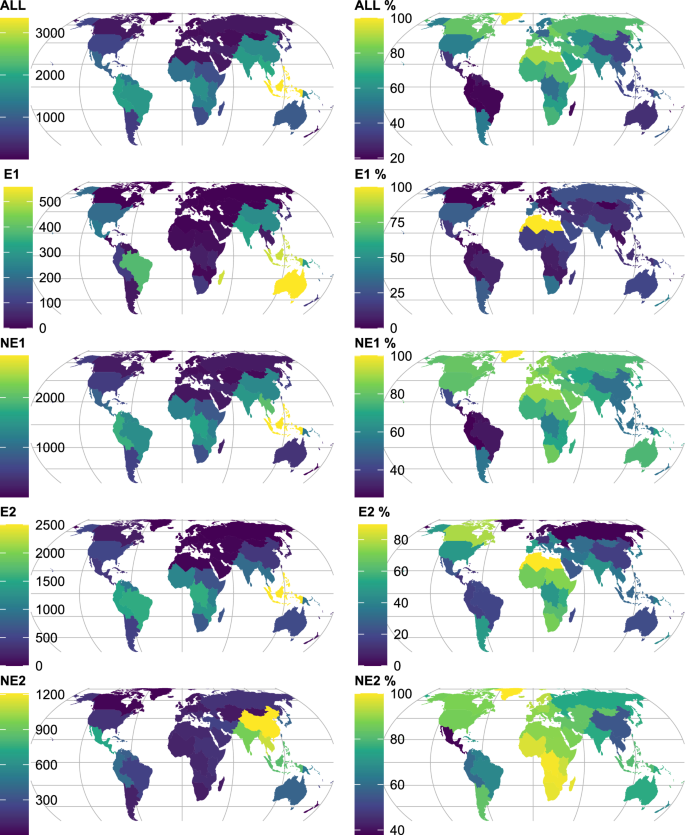
Subcontinental patterns of endemism for GlobalUsefulNativeTrees. ALL, All species in GlobUNT. E1, Species in GlobUNT native to one country only. NE1, Species in GlobUNT native to two countries or more. E2, Species in GlobUNT native to one continent only. NE2, Species in GlobUNT native to two continent or more. ALL %-NE %, Richness of left-hand panel expressed as percentages from the total number of species in GlobalTreeSearch in the same category. Supplementary Table 2 includes data on endemism for 242 countries and territories, 42 subcontinents and 8 continents. Supplementary Figure 2 provides country boundaries. Map created in R with Equal Earth projection.
When defining endemic species by those useful tree species that were native to one continent only, the species richness of endemic species was largest in Malesia (2502), West-Central Tropical Africa (1547) and Brazil (1541).
The most widely distributed useful tree species across subcontinents were Dodonaea viscosa (28 subcontinents, 7 continents), Ximenia americana (24, 7), Sophora tomentosa (23, 7), Hibiscus tiliaceus (22, 7), Pisonia aculeata (22, 7), Tephrosia purpurea (20, 5), Thespesia populnea (20, 7), Suriana maritima (19, 7), Avicennia marina (18, 5), Trema orientale (18, 5) and Vitex trifolia (18, 6).
Defining useful threatened tree species as those with the IUCN Red List categories of Critically Endangered (CR), Endangered (EN) or Vulnerable (VU) resulted in the subcontinent of Malesia hosting the highest number of threatened species (STHR = 382; Fig. 3) with the Western Indian Ocean ranked second (245). These subcontinents showed the same ranking for CR (60 and 55 species, respectively) and EN (111 and 108, respectively). For VU, Malesia ranked first once again (211 species), but the Indian subcontinent ranked second (111).
Figure 3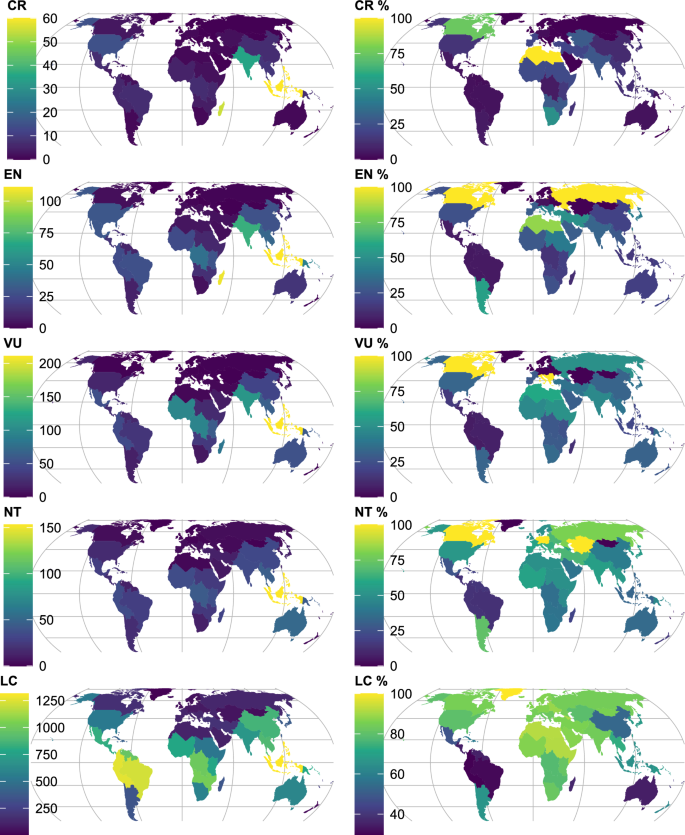
Subcontinental patterns of threatened useful tree species for GlobalUsefulNativeTrees. CR, Critically Endangered species. EN, Endangered species. VU, Vulnerable species. NT, Near Threatened species. LC, Species of Least Concern. CR %-LC %, Richness of left-hand panel expressed as percentages from the total number of species in GlobalTreeSearch in the same category. Supplementary Table 3 includes data on threats for 242 countries and territories, 42 subcontinents and 8 continents. Supplementary Figure 3 provides country boundaries. Map created in R with Equal Earth projection.
The Malesian countries of Indonesia and Malaysia contained the highest numbers of threatened species (240 and 219 species, respectively; Supplementary Table 3). Madagascar had the highest number for EN (96). Sri Lanka ranked fourth overall in numbers of threatened species and also had more than twice the number of CR species than the fifth ranked India. Globally, percentages of threatened species were below 17% for the different categories for threatened species, whereas the percentage for LC was 40.4%.
www.nature.com
https://www.nature.com/articles/s41598-023-39552-1


